Code
#install.packages('naniar')
library("readxl")
library('naniar')
library('ggplot2')

df <- read_excel("data/CoralBleaching.xlsx")We discovered this Coral Bleaching Dataset from the Harvard WorldFish Dataverse. Per Harvard Dataverse, an initial database of bleaching observations was compiled by the UN Environment Programme World Conservation Monitoring Centre (UNEP-WCMC) using a variety of sources. This database has been expanded by Dr. J. Oliver, Mr. Y. Yusuf and Ms. Nurulhuda Ahmad Fatan from WorldFish, using information from the ReefBase database, the Great Barrier Reef Marine Park Authority (GBRMPA), the CoralList, and other sources of information. This dataset was published on January 1, 2016. [4] This dataset is provided in Excel format, and we plan to import the data via the read_excel() function in R.
The data consists of 28 feature columns and 6,190 row entries. Only about 11 of these columns have complete or mostly complete entries–which are the more useful columns–containing geographic information of various degrees as well as bleaching severity: Region, Subregion, Country Location, Longitude & Latitude coordinates, Bleaching_Severity, Severity_Code, Depth, Year, among others. This dataset also includes observations indicating no bleaching. Even though this dataset was published in 2016, this is shockingly one of the more recent datasets we could find related to coral bleaching; thus, there have been no updates to this specific dataset. The low frequency of updates available in measuring coral health on this scope further aids in highlighting the disparity of data availability and lack of necessary public attention on this crucial area of oceanic health within the Earth and Environmental Sciences.
[4] ReefBase, 2016, “Coral Bleaching Data”, https://doi.org/10.7910/DVN/KUVQKY, Harvard Dataverse, V1
#install.packages('naniar')
library("readxl")
library('naniar')
library('ggplot2')
df <- read_excel("data/CoralBleaching.xlsx")# Visualization 1
vis_miss(df) + labs(title = "Missing Values per Variable")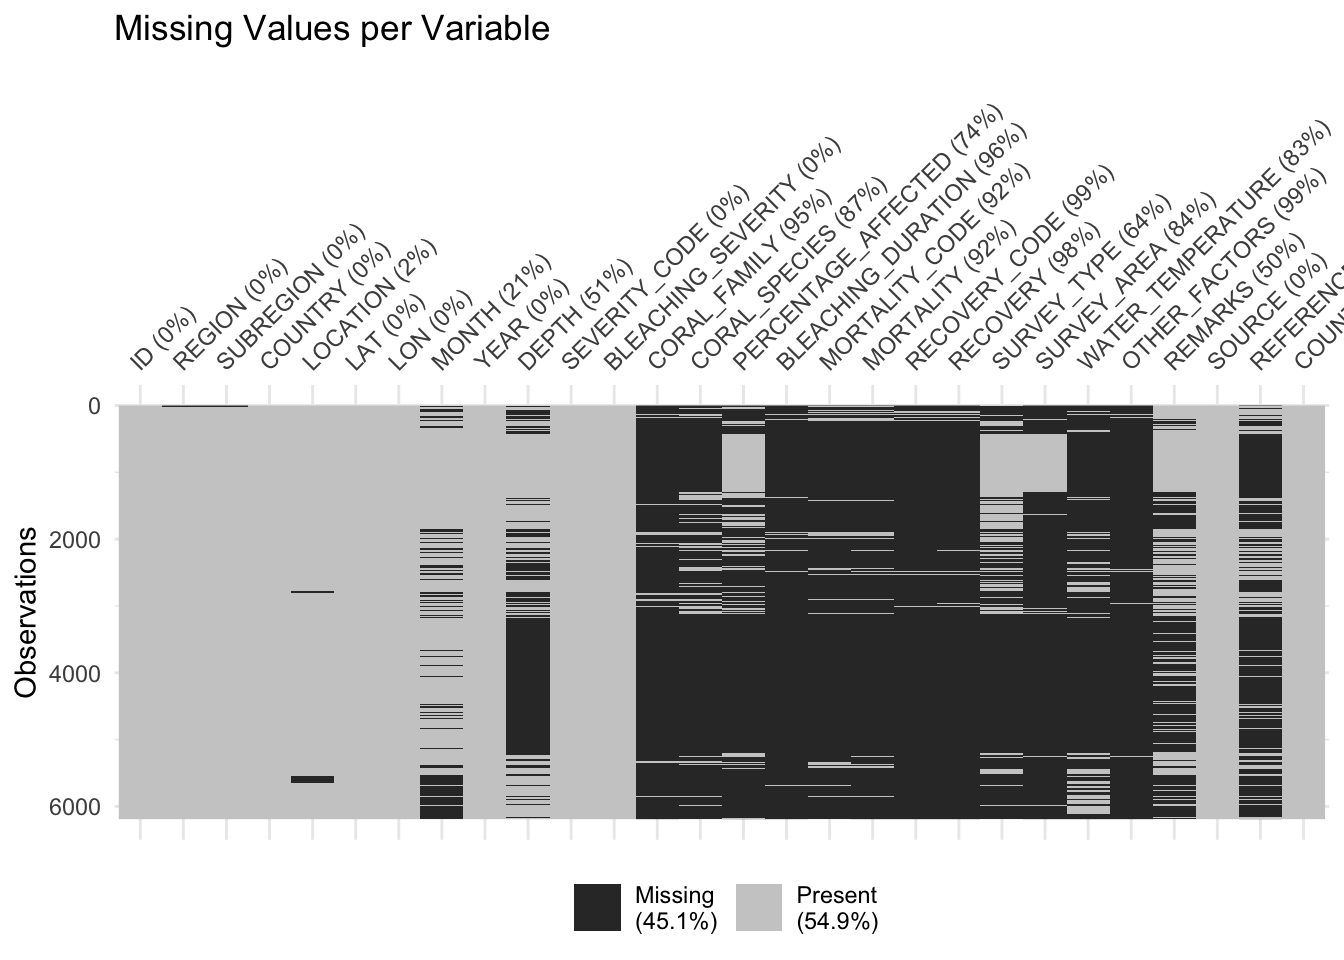
This graph allows us to understand the percentage of missing values existing in each column of the Coral Bleaching dataset. Columns with a low percentage (<=5%) of missing values include: ID, REGION, SUBREGION, COUNTRY, LOCATION, LAT, LON, YEAR, SEVERITY_CODE, BLEACHING_SEVERITY, SOURCE, REFERENCE_CODE, and COUNTRY_CODE. Columns with a high percentage (>5%) of missing values include: MONTH, DEPTH, CORAL_FAMILY, CORAL_SPECIES, PERCENTAGE_AFFECTED, BLEACHING_DURATION, MORTALITY_CODE, MORTALITY, RECOVERY_CODE, RECOVERY, SURVEY_TYPE, SURVEY_AREA, WATER_TEMPERATURE, OTHER_FACTORS, and REMARKS. The total percentage of missing data is 45.1%. While this proportion is relatively high, the dataset is still viable because the missing data primarily exists in columns that will not be used in our EDA.
# Visualization 2
gg_miss_fct(x = df, fct = BLEACHING_SEVERITY) + labs(title = "Missing Values Faceted on Bleaching Severity")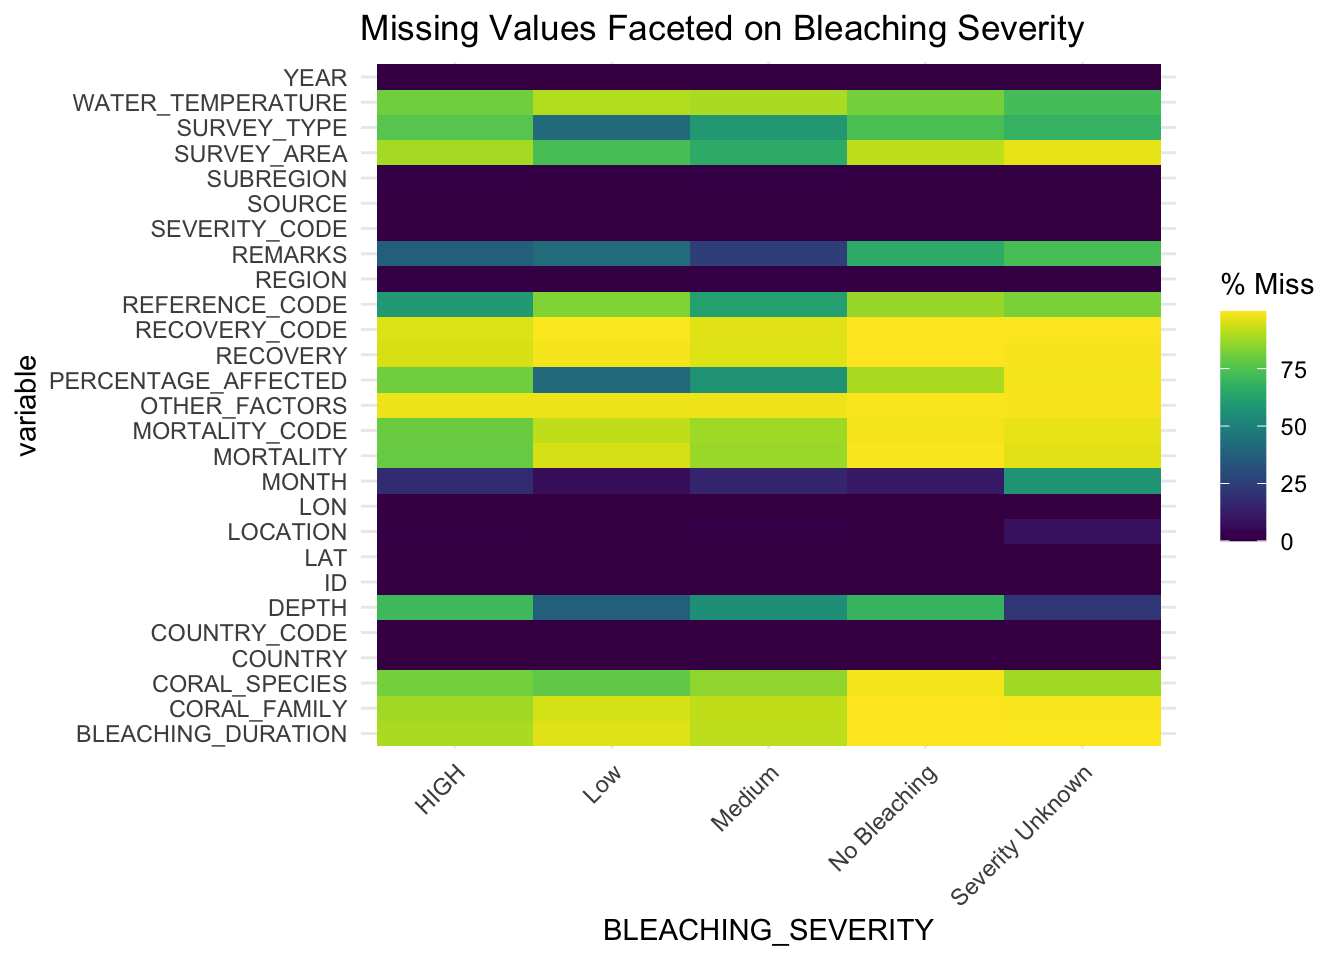
This graph depicts the percentage of missing values per column faceted on BLEACHING_SEVERITY. BLEACHING_SEVERITY is an important variable in understanding the level of coral bleaching recorded over time at different locations. We can use this visualization to understand if any of the outcomes of BLEACHING_SEVERITY contains a significant percentage of missing data.